how can you identify the most important and the most powerful levels of structure they give you the best chances of capturing trends and banking in massive profits.
你該如何辨識最重要的結構層級,以及這些層級如何為你帶來捕捉趨勢和獲取豐厚利潤的最佳機會?
00:12
welcome to the trading channel guys my name is Steven you're honest trading coach and in today's video you're gonna be learning how to identify the most powerful and most important levels of structure to give you the best chances of baking in massive profits in just a few moments I'm gonna be sharing with you guys some extremely valuable information that could be what you've been missing in your trading all along.
so if that sounds interesting to you then go ahead and click that subscribe button click the notification bell to make sure you're alerted whenever we come out with videos like this we do a tutorial video just like this each and every week along with a Monday market breakdown video discussing a few trade ideas.
every single Monday YouTube does take a couple of days to notify you after you subscribe and even if you hit the notification bell so if you'd like faster alerts about those Monday market breakdown videos and to receive some other free training from us then head over to the trading channel net and sign up for our email list.
while you do that I'm gonna let the intro and disclaimer roll go ahead and click that like button for us to help support the channel and I'll see you guys on the other side.
在你這樣做的同時,我會讓影片的開場和免責聲明播放完畢。請點擊喜歡按鈕以支持我們的頻道,稍後再見!
01:21
welcome back guys so first off let's actually talk about why you should be interested in learning how to identify these powerful and important levels of structure.
各位,歡迎回來!首先,我們來談談為什麼你應該對學習如何辨識這些強大且重要的結構層級感興趣。
01:31
well for starters here we are on the euro yen daily chart and on this chart using exactly what I'm gonna teach you today would have banked in over 800 pips on this move right here we also would have banked in over 600 pips on this move right here using this analysis and we're actually coming up on a possible short trade using this analysis at the moment.
but we'll discuss a little more about that later on in the video and we'll also be taking a look at this on multiple timeframes in multiple different pairs this is not something that only works on the daily timeframe and it's definitely not something that only works on a specific pair this is just knowing an understanding market structure and how the market moves.
so let's go up to a blank chart so let's discuss a little more about structure let's imagine you're getting on a plane and you're going from Atlanta Georgia all the way to California and I know you're probably thinking what does this have to do with structure but I promise it's gonna make sense in just a moment.
let's say you start to take off here in Atlanta as your planes on the rise you hit small amounts of turbulence on the way up small amounts of turbulence on the way up and then the plane drops 500 feet out of the air before taking back off again and it does that once more.
tell me something in this scenario are you going to remember these tiny little moments of turbulence probably not right will you remember these very large drops and moments of turbulence yes you're going to remember those right well this is exactly how the market works as well.
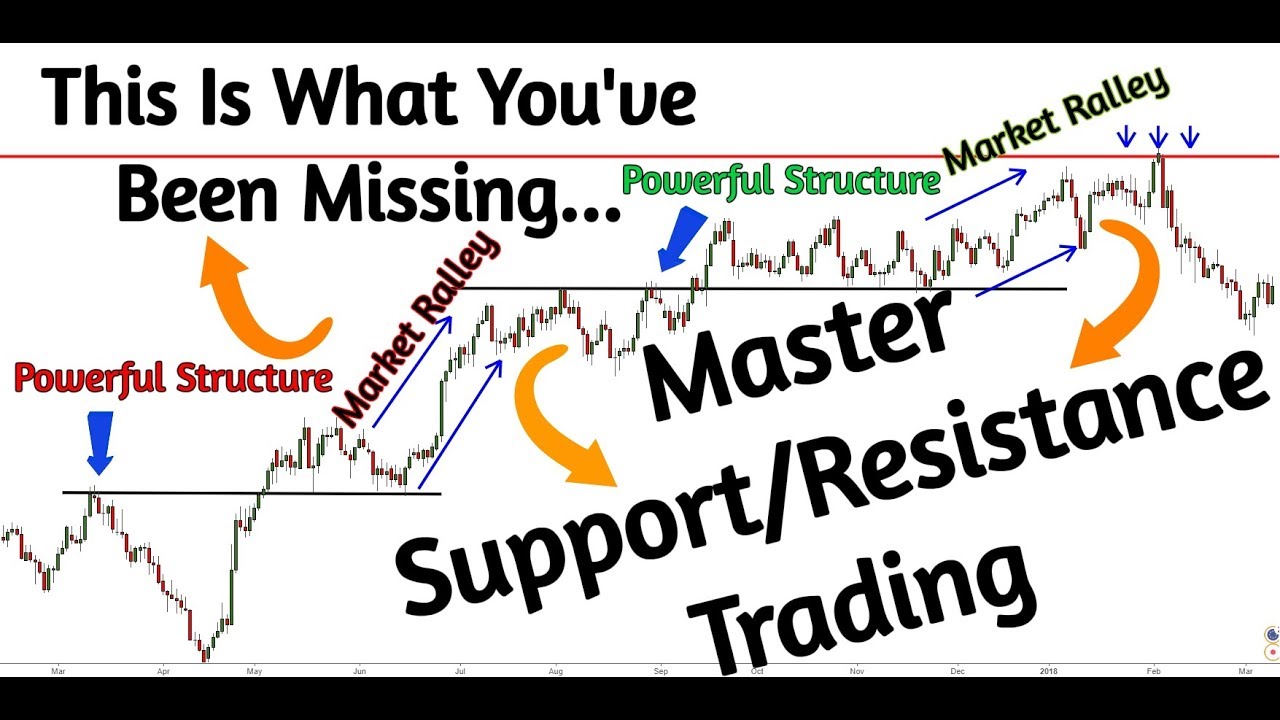
in order to spot major levels of structure we can't be looking at these little tiny pullbacks that would be the small amount of turbulence you would hit on your way up to cruising altitude in a plane what we want to be looking for is spots that the markets going to remember again imagine it as a plane look what are the spots you would remember of turbulence if you were taking off an airplane you want to find those areas and that's where you want to draw your resistance and support lines right.
these are going to be the major and powerful levels of support and resistance and we're going to discuss a few other conditions that we're going to apply to this as well it's not just the fact that we have large moves down something else we need to pay attention to is the fact that in a trending market trending being higher highs and higher lows the very most important level of structure.
in a trending market is always going to be the most previous level of structures that was broken right here so if we have a trending market the most important and the most probable area you have to find an entry reason and capture a winning trade that's gonna equal massive amounts of profits is right back at the previous level of resistance now.
just implementing this could completely turn your trading around this can completely change your trading and why you might ask well because before now you've probably been looking at tons of different structure levels in order to try to figure out what's major what's minor how are we gonna trade around it well what if you only looked at previous structure resistance that was just broken for possible support how much more simple would your trading plan would your strategy be if that was the case exactly.
so not only this but we're also going to implement and what I'm also gonna be teaching you guys today is how to spot very important levels of structure that happen after consolidation so the most important for a trending market of course is the previous level of resistance that was broken let's say we have an uptrend the previous level of resistance that was broken is going to be the most important and most powerful level of structure we can find.
now let's say we're at our cruising altitude hit a little bit of turbulence up here that's probably enough of the airplane analogy honestly so we'll just continue here but then let's say we get this drop right here if we were using the airplane analogy we're heading down to the landing strip.
after this drop something we can pay attention to again we're looking at the most recent level of structure that was broken what's the most recent level of structure broken right here but here we have even more power and even or important level of structure the reason being because this was previously a level of consolidation we have multiple touches in this level so once the market breaks through that that's gonna be a very accurate a very powerful and a very important level of structure to pay attention to for trading opportunities in the future to push the market down.
and as we go into trend what we're gonna be looking for is just the most previous nothing else only the most previous level of support that was broken in a downtrend so once we have that most previous level of support that was broken in the downtrend we can place a horizontal line there.
you can just watch it on your chart wait for the market to get there provide you some kind of reason for entry and push back down now tell me something would that be a level of significant structure with that no these two levels would not be significant you would not remember that as turbulence if you were coming down to the landing strip on your plane rod.
and we actually need rules to try to define these right or at least outlines of what these smaller levels are we need outlines of what we can actually count as major structure support and resistance the way I like to do this is if these little areas are two or less candles and they do not retrace a very large amount let's say more than 38.2% this way you can actually use a fibonacci so if this right here is not a 38.2% retracement of our high to low move and it's less than two candles then this would not count as structure so that's just a brief overview of how you would create rules for that that's not something we're going to dive into in this video it's a little more complicated stuff that we discuss over at the EAP.
so I know that may have been a little bit drawn-out but hopefully now you have a really good understanding of what we're gonna be looking for in today's video and how we're gonna be spotting these important and powerful levels of structure now we'll go down to the charts take a look at a few live examples of this and later on in the video I'll be showing you guys an indicator that you can combine with this analysis that can increase the probability of hitting these massive trades even more.
so make sure to stick around to Lee and for that let's go ahead and go down to some live charts and take a look at a few examples ok guys so here we are back on the euro yen chart and now we're gonna discuss this analysis once more now that you have the knowledge we just discussed with our airplane analogy but before we do that to show you guys that we actually trade based on this type of analysis.
I'm not currently in any open positions using this type of analysis but we did have a trade on Monday in the EAP training program using this analysis so let's go ahead and go over to that email right here's that email that was sent out to traders three six which was Monday and as you can see on the chart in front of you what we had here was a break above a previous resistance while a market was in trend this is our previous resistance in what we waited for is the market to pull back to that resistance level before opening a position to go long we ended up getting first targets hit on this trade for around eighty two pips we'll head over to the dollar canada chart and show you guys the profits on this and guys if you learn more about how to get emails like this three to five times a week and join us in the EAP training program then to learn more about how to do that there's a link in the description labeled EAP training program.
heading back over to the charts now let's look at the dollar canada we'll go back over to the email scroll down as you can see our first target was at one point two nine nine nine if we go back over to the dollar canada chart and place a horizontal line at one point two nine nine nine as you can see we barely ended up getting those first targets clipped here on this trade so that ended up being a win of over eighty 3 pips using the exact analysis we're talking about in this video as you can see just to go over it one more time we have a market in an uptrend big turbulence here or that major level of structure before breaking back above that level of resistance and then the pull back into that resistance gave us opportunity to enter the market and capture over eighty two pips of profit.
and now we'll drop down to a four-hour chart I'll show you guys just a couple of other examples of this so you can see that it doesn't only work on the daily chart here on the four-hour I already spot one we have this push down big turbulence right consolidation area one two three touches after we get a break below these touches what happens the market pulls back up directly into that previous level of structure and let's go ahead do this on one more pair let's go ahead and go to a different chart let's do the pounce with this is gonna be completely random guys and let's go down to a 15-minute chart.
so on the pound Swiss 15-minute chart again this was completely random I did not look through charts to try to find the best ones for this or anything like that but here as you can see we have a previous level of resistance right here the market pushes up breaks above that previous level of resistance then what happens we pull down right into that level of resistance and so far we started up into new highs I would actually expect this to break into new highs and continue into trend continuation here on the pound Swiss.
so there's a few other examples on different pairs in different timeframes of this working out now we're gonna do is discuss a way you can add an indicator to this to actually make this more non subjective meaning easier to follow with a set of rules and even more accurate so let's head to a different chart and do that now ok guys so here we are on the dollar Canon and what we're gonna do now is just combine a very simple indicator with this structure based analysis we just talked about in today's video and I'm gonna show you guys how to create non-subjective rules to build a strategy around or to build a trading plan around for absolutely free.
so guys if you found value in today's video then make sure you go ahead and click that like button for me if you find this content helpful and you want to learn more about some of our other paid programs and dive a little deeper into your Forex education then you can find out more about those by clicking the link in the description labeled EAP training program or by going over to the trading channel dotnet.
but let's let's go ahead and apply the indicator here on the dollar Canada we're on the dollar Canada one-hour chart again changing timeframes changing pairs to show you guys that this works all around and let's go ahead and apply the indicator now which is going to be nothing more than a 200 day exponential moving average so I'll go ahead and let you guys see me edit this so you can see that this is exactly what I'm doing make it black so it's easy to see a little bit thicker and 200-day exponential moving average okay.
now that we have the 200-day moving average on the screen there are rules we can apply to make this almost completely non subjective meaning easier to follow with a set of rules and even more accurate so let's head to a different chart and do that now ok guys so here we are on the dollar Canon and what we're gonna do now is just combine a very simple indicator with this structure based analysis we just talked about in today's video and I'm gonna show you guys how to create non-subjective rules to build a strategy around or to build a trading plan around for absolutely free.
now that we have the 200-day moving average on the screen there are rules we can apply to make this almost completely non subjective meaning easier to follow with a set of rules and even more accurate so let's head to a different chart and do that now ok guys so here we are on the dollar Canon and what we're gonna do now is just combine a very simple indicator with this structure based analysis we just talked about in today's video and I'm gonna show you guys how to create non-subjective rules to build a strategy around or to build a trading plan around for absolutely free.
what did we just talk about we wanted to get this pullback into this previous level structure was this a major level of structure yes this would have been a large amount of turbulence in an airplane right so that major level of structure after the market breaks above the 200-day moving average and that level of structure then pulls back into it would be a great place to look for some buying opportunities we get those buying opportunities we push up we do what now we break above our previous level of resistance right that previous level of resistance is right there then what happens this level of resistance does it look like it would be a spot you would remember on an airplane if you started to take off and had this big drop out of the sky due to turbulence yes right this level right here this big drop would definitely be something you would remember so it is a major level of structure after breaking above it we pull back to our most recent level of structures that we broke boom.
we pull back into that area we get another push higher this push higher breaks above what our previous level of major structure again airplane this would be big turbulence this is the most recent level of structure that we broke we come across the market pulls back doesn't quite get there again it's not going to get there every single time you're not gonna get a trading opportunity every time you break in a new highs but this is the most accurate place in a trending market to capture large gains and massive profits so let's go ahead and scroll the chart sideways now this is our new level of structure that's just been broken that's what we're gonna be paying attention to scrolling sideways and now we have another new level because of this consolidation in through here this would have been major turbulence pushing down right so this is going to be our level of structure right in here where our line is at one point two six eight even.
that's what we're gonna be looking for for possible trades market pulls down into that area gives us a trade boom okay let's see that again this area what did I say one point two six eight as soon as the market pulled down into one point two six eight we got this massive push up awesome let's continue continuing continuing here would be an example of a loss we have the market pushing breaking above our previous levels of resistance pulling back into those levels of resistance if we would have gotten an opportunity here to enter the trade based on an entry reason then more than like who would have been stopped out of that trade on the way down.
所以,這就是我們要找的東西,市場回撤到這個區域,給了我們一個交易機會,然後市場上了。
15:16
and now something interesting happened now we started creating new lows well we're not looking for a trade anymore at all until we break into new highs because we're looking for trades based on our most recent level of structure breaking so we're not looking for anything we're not looking for you think now we're looking for trades why we just broke above our most recent high this would not be a pullback we'd remember on a plane this is not our major structure this is our major structure continuing looking for trades at one point two six six even pulling back now getting pretty close that would have been really close to our zone really I mean looking right in here at this previous zone of resistance and let's see what happens with the market.
we get that pretty big push up awesome next up we would be looking right here one point two seven one four possible trades market pushes up then we break above our next resistance level here what happens after that we pull back into that resistance level and push up.
and guys that's all I'm gonna do for today this is gonna get really drawn-out I'm sitting here looking at the time on this video and it's getting pretty long as it is so as you can see this works on multiple timeframes with multiple pairs and adding that 200-day moving average or your choice of moving average or adding other conditions is not against the rules you can add any other conditions to this type of analysis in order to make it more accurate for you if you're someone who's been struggling in your trading for a while and you enjoy trading content like this or you just enjoy learning about the skill of trading learning new strategies entry reasons learning about psychology risk management and all the key factors it takes to actually become profitable as a trader.
and you're tired of searching through free YouTube videos to try to create massive success in your trading career then click the link in the description labeled EAP training program this program has helped hundreds and hundreds of traders throughout the last couple of years on their path to becoming profitable as you can see from this video guys I've just really enjoyed bringing value to traders and helping them on their journey to becoming profitable because I went through it too.
I went through the struggle of losing money blowing accounts I went through the struggle of being frustrated because you feel like Forex is just a scam and that nobody's out here actually making money but I found a way out of those struggles I found a way to actually become a profitable trader and now I really enjoy sharing that information sharing that knowledge with you guys one through free educational content like this and with some even more advanced training that we offer in our paid programs so again if you're interested in that check out the link in the description labeled EAP or head over to the trading channel dotnet.
stick around for the outro to see a few testimonials of traders that have been through those programs make sure you subscribe here to be alerted about free content we come out with on YouTube make sure you go over to the trading channel sign up for our email list for another free structured training similar to this I wish you guys the best of luck on your future trades hope you have a great weekend and I'll talk to you in the next video.
3如果一個回撤區域少於兩根K線且回撤幅度超過38.2%,那麼它被認為是...If a retracement area is less than two candles but retraces more than 38.2%, it is considered...如果一個回撤區域少於兩根K線且回撤幅度超過38.2%,那麼它被認為是...
If a retracement area is less than two candles but retraces more than 38.2%, it is considered...