I have a three-step formula that I back tested thousands of times, and every single month that I tested it, it was profitable in the long term. No indicators, no patterns, just pure price action, baby!
That really is a fun part of this whole technique. I have—I have more pleasure just beating the brush than anybody in the country.
這真的是這整個技巧中最有趣的部分。我——我比國內任何人都更享受「掃蕩」的樂趣。
00:17
And by the end of this video, you too will know the strategy, and we'll be able to take calculated trades.
影片結束時,你也會知道這個策略,並且能夠進行有計畫的交易。
00:23
Just like this one, and make insane amounts of money!
就像這筆一樣,賺取驚人的財富!
00:27
WOOOOOOO!
嗚嗚嗚!
00:28
To jump right into it, the first step involves market structure.
直接切入正題,第一步涉及市場結構。
00:31
Now this is arguably one of the most important steps, because if you even just slightly f**k this part up, it will ruin the whole strategy.
這可以說是其中最重要的一步,因為如果你在這部分稍微搞砸一點,就會毀掉整個策略。
00:38
Come on now, dawg!
來吧,夥計!
00:40
Come on, man!
來吧,老兄!
00:42
One of the very first things you learn as a trader is uptrends and downtrends.
作為交易者,你學到的第一件事就是上升趨勢和下降趨勢。
00:46
It's almost like the sippy cup of trading.
這幾乎就像是交易的「學習杯」。
00:48
A chart that makes higher highs and higher lows is an uptrend.
創出更高的高點和更高的低點的圖表就是上升趨勢。
00:51
A chart that makes lower lows and lower highs is a downtrend.
創出更低的低點和更低的點的圖表就是下降趨勢。
00:54
Simple enough, everybody knows this.
夠簡單了吧,大家都知道。
00:56
Now you may be thinking, why are you even going over this? I already know all this!
現在你可能會想,你為什麼要講這些?我都知道了!
00:59
Well, what if I told you you're probably doing all this completely wrong? Let me explain.
那麼,如果我告訴你,你可能完全做錯了呢?讓我來解釋。
01:04
So, going back to our example, the chart does this, making higher highs and higher lows, and as we already stated, it's an uptrend, okay, but then something interesting happened.
The short starts heading downwards, which, in this process, price makes this low and breaks right through it.
空頭開始向下移動,在這個過程中,價格創出這個低點然後直接跌破它。
01:18
And this exact point is where I see the majority of traders make the mistake.
而我看到大多數交易者犯錯的正是這個點。
01:22
Since price broke this low, a lot of traders think we are now in a reversal and price is in a downtrend.
由於價格跌破了這個低點,很多交易者認為我們現在處於反轉,價格處於下降趨勢。
01:27
So, in return, they start looking for short trades because they now think price is going to head lower.
作為回報,他們開始尋找賣空交易,因為他們現在認為價格將會下跌。
01:32
But what if I told you this chart is actually still fundamentally bullish?
但如果我告訴你這張圖表實際上仍然是看漲的呢?
01:37
You see, sure, price made this low, but this low is actually not a low at all, or at least a valid one.
你看,當然,價格創下了這個低點,但這個低點實際上並不是一個真正的低點,或者至少不是一個有效的低點。
01:44
Why? Because price never broke the valid low, which is right here.
為什麼?因為價格從未跌破有效低點,而有效低點就在這裡。
01:47
I want to make this very clear: in order for a low to be validated, it needs to break the previous high. If you do not understand this part of the strategy, the strategy will not work.
Fired! So, say if price does break this high, we now know this is a valid low.
被解僱了!所以,假設價格確實跌破了這個高點,我們現在就知道這是一個有效的低點。
02:06
Okay, good. So now price is in an uptrend, which means we should only look for bullish trades.
好的,很好。所以現在價格處於上升趨勢,這意味著我們應該只尋找看漲交易。
02:12
The only time we should start looking for short trades is if price breaks this low.
我們應該開始尋找賣空交易的唯一時機是當價格跌破這個低點時。
02:16
It can do anything right here—it can go up, down, sideways, literally anything—as long as it doesn't break this low.
在這裡,它可以做任何事情——它可以上漲、下跌、盤整,真的任何事情——只要它不跌破這個低點。
02:22
We are in an uptrend. Now, say even instead of doing this, price did end up breaking up.
我們處於上升趨勢。現在,假設即使不是這樣,價格最終還是向上突破了。
02:26
Since price did break her previous high, our new low will be transferred from this point to this one.
由於價格確實突破了先前的高點,我們新的低點將從這一點轉移到這一點。
02:32
So that's the first step: identifying if we are in an uptrend or downtrend. So, what's next?
所以這是第一步:確定我們處於上升趨勢還是下降趨勢。那麼,接下來是什麼?
02:37
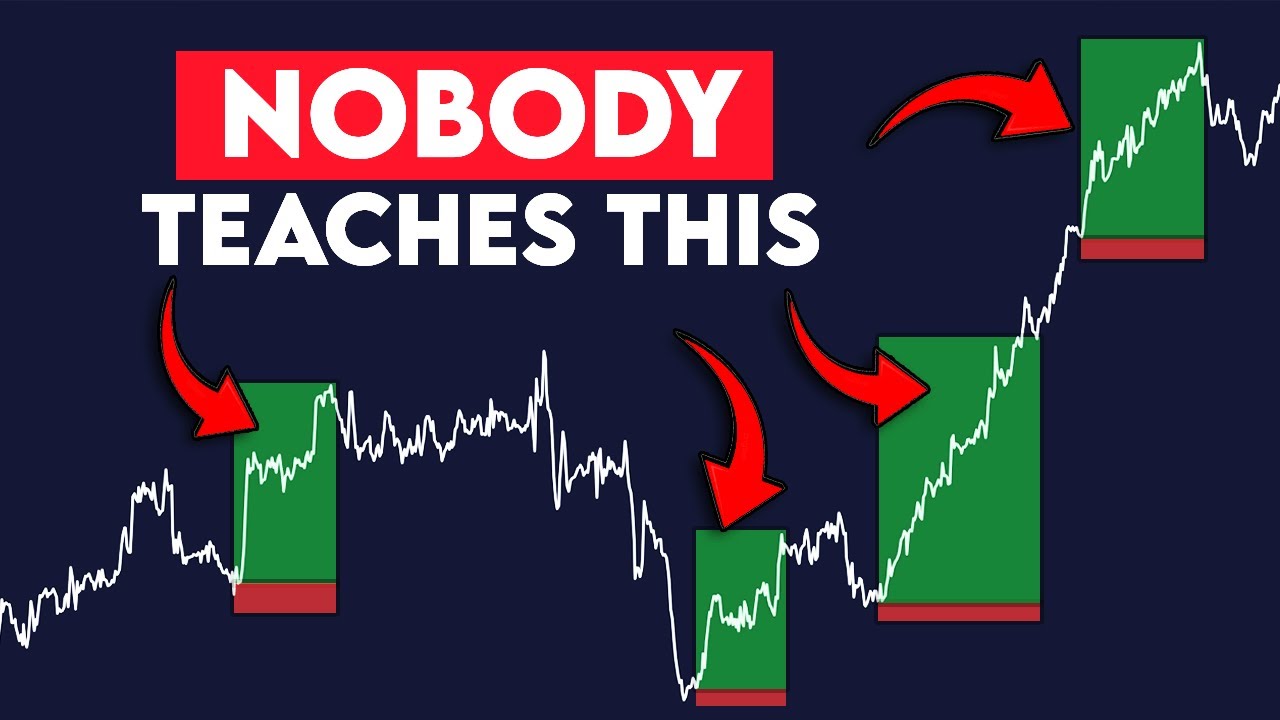
That would be step two in the formula. Step two is identifying supply and demand in the markets.
這將是公式中的第二步。第二步是識別市場中的供需。
02:42
Demand zones take place in uptrends.
需求區域發生在上升趨勢中。
02:44
Supply zones take place in downtrends. A good style of thinking is you want to buy from demand zones and sell from supply zones.
供給區域發生在下降趨勢中。一個好的思考方式是,你想從需求區域買入,從供給區域賣出。
02:51
Here, if we look closely, the market is going up since we saw a large push from the beginning of this move.
在這裡,如果我們仔細觀察,市場正在上漲,因為我們從這波走勢的開頭看到了大幅的推升。
02:56
It simply shows us that a lot of people wanted to buy from this point onward.
這只是向我們表明,從此時開始,很多人想買入。
03:01
So we can assume if price comes back down to this area, traders will have the same style of thinking and want to buy in the same area again.
所以我們可以假設,如果價格回落到這個區域,交易者也會有同樣的思考方式,並想在同一個區域再次買入。
03:08
Oh!
噢!
03:10
Nice. A supply zone is the exact opposite, since we saw a large downwards move from this point on.
很好。供給區正好相反,因為我們看到價格從這個點大幅下跌。
03:16
It shows us that a lot of people want to sell at this area.
這顯示了很多人想在這個區域賣出。
03:19
So, if price ever retests this zone, we can assume price will again move downwards from this point.
所以,如果價格再次測試這個區域,我們可以假設價格將再次從這個點下跌。
03:25
This supply and demand theory is the core of our strategy.
這個供需理論是我們策略的核心。
03:28
But we still have one more step in our three-step formula.
但我們的三步驟公式還有最後一步。
03:31
But let me show you some trading profits real quick.
但讓我快速給你們看一些交易獲利。
03:34
I made a video the other month saying I was going to try to use hankertrades copy trading feature.
我上個月做了一個影片,說我將嘗試使用 hankertrades 的跟單交易功能。
03:38
Where you can copy professional analysts by simply clicking a button. Now, when they first asked me to test this, I was a little skeptical at first—I'm not gonna lie—but I decided I wanted to test it out for myself.
So now that we know we're in an uptrend, we want to look for demand zone opportunities.
所以現在我們知道我們處於上升趨勢,我們想尋找需求區域的機會。
04:59
We can find our demand zones by finding an area of consolidation or a point where price moves sideways for having a sharp move upward.
我們可以通過尋找一個盤整區域或價格橫盤移動然後急劇上漲的點來找到我們的需求區域。
05:07
As you can see from this chart, we had some consolidation right here.
從這張圖表中可以看到,我們在這裡有一些盤整。
05:11
The price shot straight up afterward.
之後價格直線飆升。
05:13
How I like to mark my demand zones is marking the candle right before the impulsive move.
我喜歡標記我的需求區域的方式是標記衝動性移動之前的蠟燭。
05:17
So grab your rectangle tool on the side, find the area of consolidation before the big move, then mark from the low to the high of the previous candle before the big move.